
Historical Investment Performance, updated to end of 2025
I've mentioned before that normally I don't present a lot around stock markets and investing - I have a hard enough time feeling knowledgeable about my own 401K! But because I like to learn from experts, I also sign up for lots of blogs and newsletters from "experts" in the investing world I trust. Earlier this week I saw an e-mail in my inbox about historical investment performance (more about who and why in the post) and thought it would be a good opportunity to remind people (teachers AND students) about the practical reasons to invest and save long-term. So here goes . . .
First, A Little Background on these Two Newsletters:
As I mentioned above, I first connected with this topic as a result of a regular newsletter I receive from "A Teachable Moment". I became aware of Tony and Dina Isola (yes, they are a married couple) as a result of seeing (and hearing) them visit with Tim Ranzetta at NGPF for his Thursday evening speaker series. I "think" I had seen them at least once before, but the one that stuck with me (and got me to subscribe to their free blog) was a conversation in Sep 2024. They are focused on better informing teachers about their financial and retirement options, particularly about alternatives to 403B programs offered by districts (or their minions). I started getting their newsletter (which is usually one featured article and 4-6 links to articles from other writers) and found that I would read at least 1-2 articles each time. For someone like me who is constantly bombarded with ideas and news articles to sift through, that's a good rate of return!
The link I found myself clicking on the most (besides Tony and Dina's own article) tended to be from their colleague Ben Carlson and his blog "A Wealth of Common Sense". While "A Teachable Moment" focuses on the financial issues of teachers, Ben's blog has a more general audience interested in investments, financial markets and investor psychology. I should also note that both of them work for (and are subsidiaries of) Ritholtz Wealth Management, which is a big investment and wealth management company. I DO NOT invest with them and don't have any money in their care - I simply use the opportunity to "pick their brains" for ideas and resources (as I do many others).
So in this case, I first clicked on the weekly "A Teachable Moment" newsletter last Thursday (came out on the 21st, but I didn't look at it until the next day). I then clicked on his link to "A Wealth of Common Sense" because his note said that Ben was doing some articles on long-term investing returns and how much (or how little) trends had changed recently. I always find this topic interesting (since I have tried to follow a long-term strategy) but more importantly I knew that Ben does a great job of finding infographics to support his arguments. So here we go - all the credit goes to Ben for finding (or creating) these . . .
Let's start with the obvious (at least to me) - I am NO expert on the stock market. And while I try to be an informed investor for my own retirement funds, I do NOT plan on giving advice to anyone else here. So this article (and any other article on investing) is not intended to be taken as a suggestion to base financial decisions on.
Other than the same advice I gave middle schoolers for 20+ years - save early, diversify your investments, and let the power of compound interest work for you! That is a lot of my focus on this particular post . . .


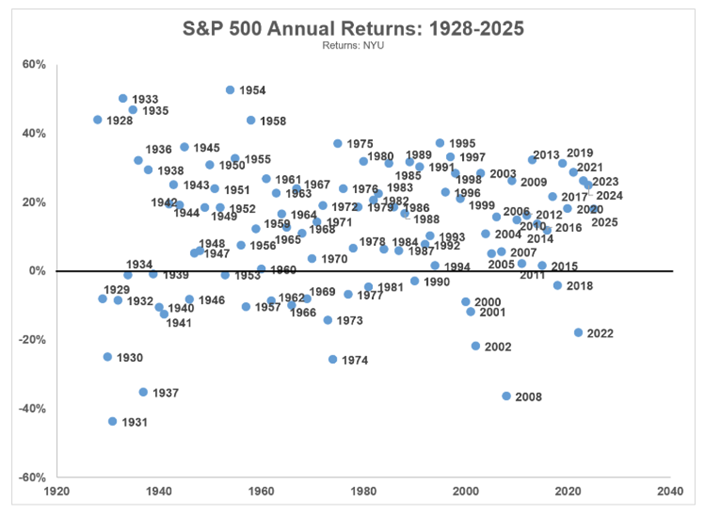
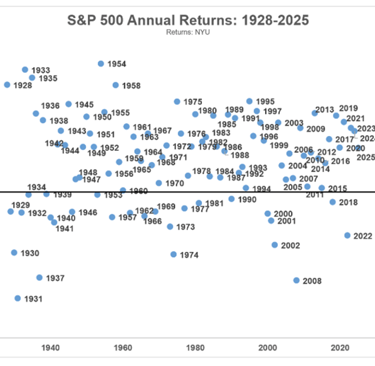
Ben breaks it down even further for stocks on this graph, showing returns on a yearly basis. Beyond the obvious (a lot more years are positive than negative) I would point out two things comparing back to the previous graph. First, stocks had only two losing decades, and both of them are driven by 1-2 really bad years. So in the 2000s, for example, 6 of the 10 years are positive - but the bad years (especially the 2008 financial crisis) are REALLY bad.
Second, notice that there are fewer peaks and valleys recently than you had in earlier decades. More years are clustered together in the 1980s, 1990s, 2010s, and the first half of this decade - 10-30% gains, but the losing years tend to be outliers rather than multi-year trends.
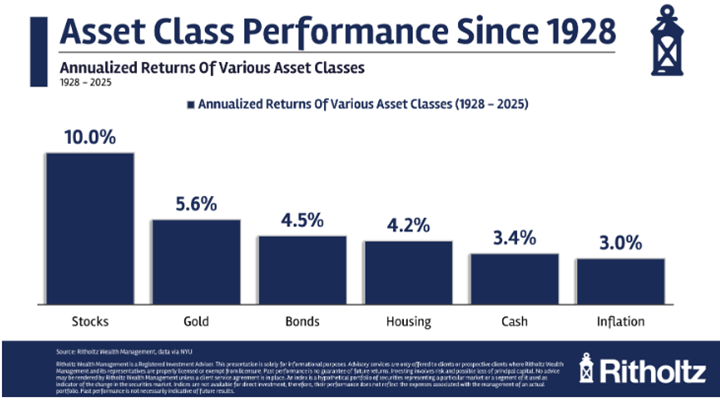
To me, this shows two things. First, it is helpful to see the advantage of a diversified mix of investments - particularly when you see that everything (even saving in cash like a savings account or CD) gets a better return than inflation.
And having said that, it is also helpful to see how much better a return over the long-term comes from stocks than other options. That doesn't mean every year will be like that (as we will see in a moment) but a good reminder why stocks should have a prominent role


So What Does the Long-Term Data Say?
All I want to do here is share some of the data Ben shared, and perhaps a little perspective on what you are seeing, and let you take it from there . . .
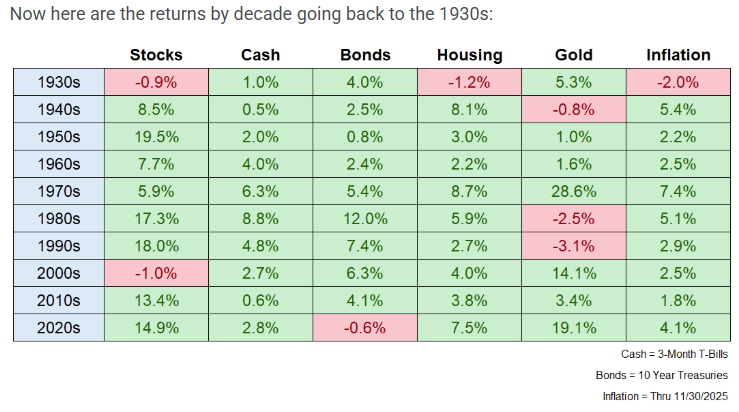
This version breaks the "big picture" (shown above) into decades. I will point out a few specifics:
Cash is the only asset class not to have a losing decade . . . but 5 of the 10 decades the return rate was lower than the rate of inflation (which means your money is losing its value)
Bonds have been very consistent, until the past few years. There are a lot of theories why bonds are currently underperforming - I don't have one to share here.
Gold is definitely a story of peaks and valleys - the decades it does well have been great, but there have also been long stretches where investors were losing money (to inflation AND overall).
Housing has stayed consistent (not a lot of peaks and valleys) but also remember that housing has other costs - taxes, insurance, etc.. And this is a national average - some markets are much higher (or lower)
As far as stocks go, save that thought for the next chart . . .
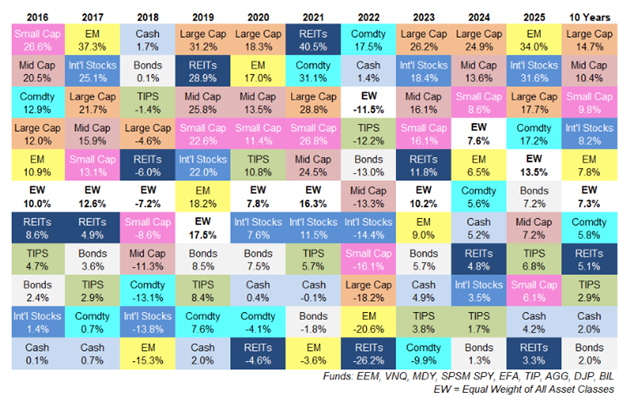
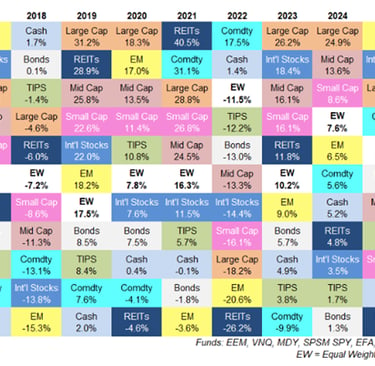
In this final graphic, we see asset returns in 9 different categories ranked (from top to bottom) by performance each year - then a 10-year average at the end. The white squares (marked "EW") reflect an equal weight average of all classes - in other words, if you put 11% of your assets into each of the 9 categories, how would you do?
I will just repeat a couple of Ben's points of emphasis (with a little commentary of my own in RED):
International stocks and emerging markets had a good 2025 - their best since 2017. What do those two years have in common? First years of Trump presidential terms . . .
Hard to guess from year to year what asset category will be on top, but the ones near the bottom have been pretty consistent this decade.
Large-cap stocks often get all the attention, but mid-cap and small-cap have done just fine over the past decade - up around 10% each. Ben reminds us that it is hard for everything to win at the same time - money buying something is usually coming as a result of selling something else.
The EW (equal-weight) block consistently ends up in the middle - not too high, not too low. That is the advantage of diversification (minimizing risk) and also the disadvantage (lower returns in some years). That's part of the reason your retirement accounts, for example, try to emphasize steady performance over peaks and valleys.
Late Addition - Forgot to include the links to sources when I posted last night . . .
Background Section
"A Teachable Moment by Tony Isola" (blog/newsletter), https://tonyisola.com/ (main page) and https://tonyisola.com/about/ (About page with Tony and Dina's backgrounds)
"A Wealth of Common Sense" (blog/newsletter), https://awealthofcommonsense.com/ (main page) and https://awealthofcommonsense.com/about-2/ (About page with Ben's background and references)
"NGPF Speaker Series - Dina and Tony Isola" (podcast), NextGen Personal Finance (NGPF), Sep 2024, https://www.ngpf.org/blog/podcasts/missed-our-speaker-series-catch-every-insight-on-the-ngpf-podcast/ (blog article summarizing the topic) and https://docs.google.com/document/d/1OkUplTrdDRBSgbpDmN390BbrO-EZmd-unuR_0nTKI-Q/preview?tab=t.0 (transcript w/link to podcast)
"NGPF Podcast: Dina and Tony Isola are the dynamic duo on a crusade to improve 403(b) plans" (podcast), NextGen Personal Finance (NGPF), Jul 2022, https://www.ngpf.org/blog/podcasts/ngpf-podcast-dina-and-tony-isola-are-the-dynamic-duo-on-a-crusade-to-improve-403b-plans/ (podcast episode and summary)
Specific Posts for this content:
"Historical Returns For Stocks, Bonds, Cash, Housing & Gold (2025)", A Wealth of Common Sense, Jan 2026, https://awealthofcommonsense.com/2026/01/historical-returns-for-stocks-bonds-cash-housing-gold-2025/
"Updating My Favorite Performance Chart For 2025", A Wealth of Common Sense, Jan 2026, https://awealthofcommonsense.com/2026/01/updating-my-favorite-performance-chart-for-2025/
And in case you want to check the numbers for yourself - another source with just the data . . .
"Historical Returns on Stocks, Bonds, and Countries", Novel Investor, Jan 2026, https://novelinvestor.com/historical-returns/
ECON and More
Curating articles for K-12 education.
CONTACT
© 2025. All rights reserved.