
The World's Most and Least Popular Leaders (Part I) - Fact vs Perspective within the U.S.
Let me start with what this ISN'T. This is NOT a political post - I have a hard enough time doing civics or current events and keeping it impartial. This is NOT support for any particular world leader - simply looking at the data and numbers. And this is NOT to support (or protest) President Donald Trump. This is a post about "fact checking" vs "perspective".
So What Does This Have to Do with Donald Trump's Approval Ratings?
Where the idea for this post came from was a graphic I saw in my in-box last week from Visual Capitalist, depicting the approval ratings of about 40 world leaders at the end of 2025/beginning of 2026. Their data was based on a "Global Leader Approval Rating Tracker" run by Morning Consult, a paysite that monitors economic, business, and political trends for their clients over an extended period of time. While I could not access all of the data on their site, though, Visual Capitalist has created similar graphics based on their data in the past (which I could access to summarize the results). I don't want to infringe on their graphic (though I include a link to it at the end of the post so you can see for yourself - here I will simply show you the header:
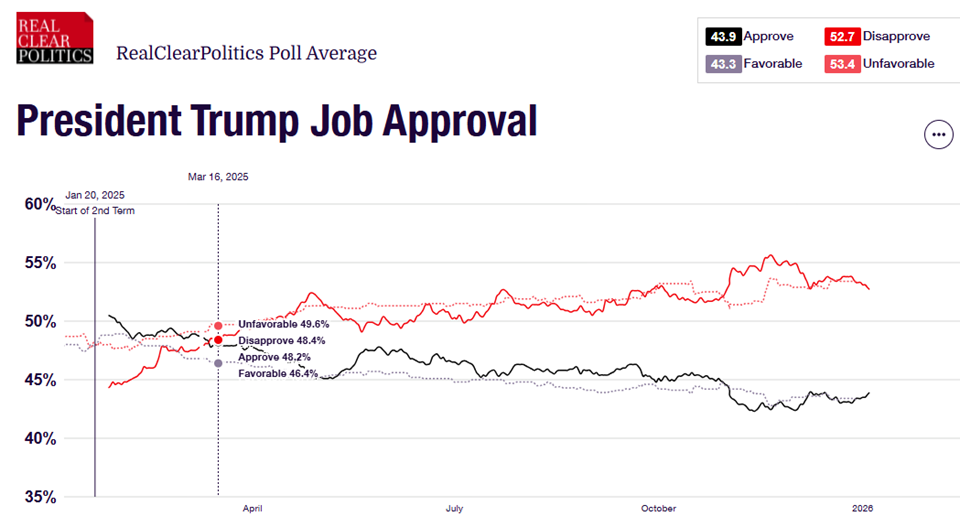
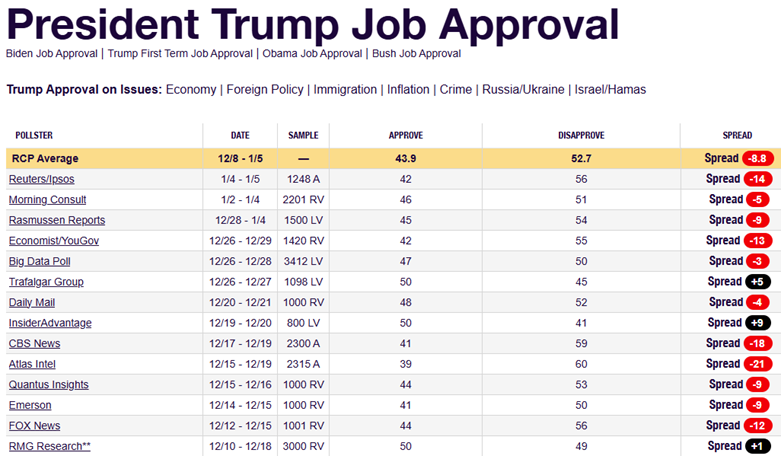
I had already seen similar headlines from other news organizations, promoting new data about Donald Trump's lowering approval rating. The graphic further above from Real Clear Politics summarizes and averages the results of dozens of polls taken over the past 1-2 months to reach a consensus (an example is shown below). I have no issues at all with their methodology or the processes used by the polls to survey people in the United States. I would agree that a 44% approval rating is probably accurate at this time and place in U.S. history.
BUT . . . what does that number actually mean? Is it good? Bad? Significant in some way? When you look around for perspective on this topic (of which there isn't much - most of the news organizations seem to believe you will just take it at face value as "less than half"), the few providing it usually point to historical comparisons. So you might hear that Joe Biden was also at 44% approval last year, or Barack Obama was higher after his first year (but under 50% approval the other 7 years), or that the highest approval ratings for presidents (Democrat OR Republican) happen after major events - like 9/11 or World War II.
One piece of perspective that rarely gets mentioned at the same time as the release of approval ratings is the unprecedented levels of partisanship contained in the results. Here are results from an August 2025 Gallup poll, for example:
Ninety-three percent of Republicans approve of Trump’s overall job performance, compared with just 1% of Democrats, a 92-point gap. This ties the record for the largest partisan divide in Gallup’s presidential approval trends.
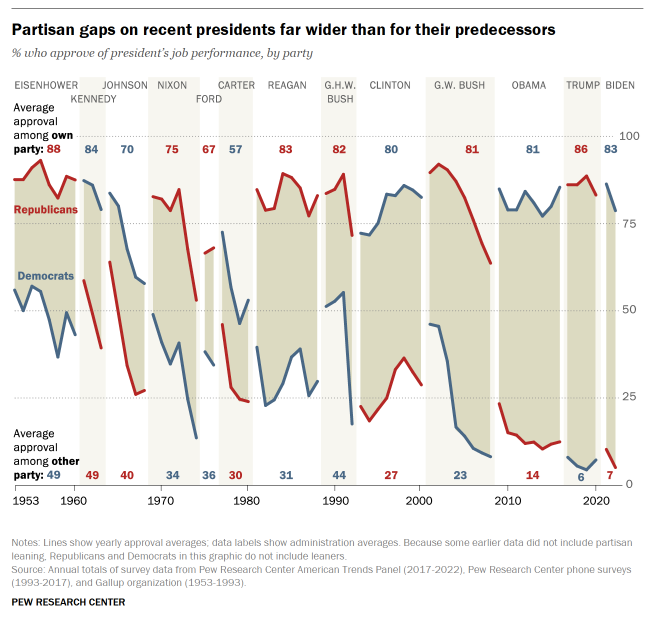
In case you believe that Trump is a unique anomaly, the data shows his numbers are simply the culmination of changes gradually happening over the past 50-75 years. Here is a graphic from Pew Research of how the partisanship trend has increased during that time:
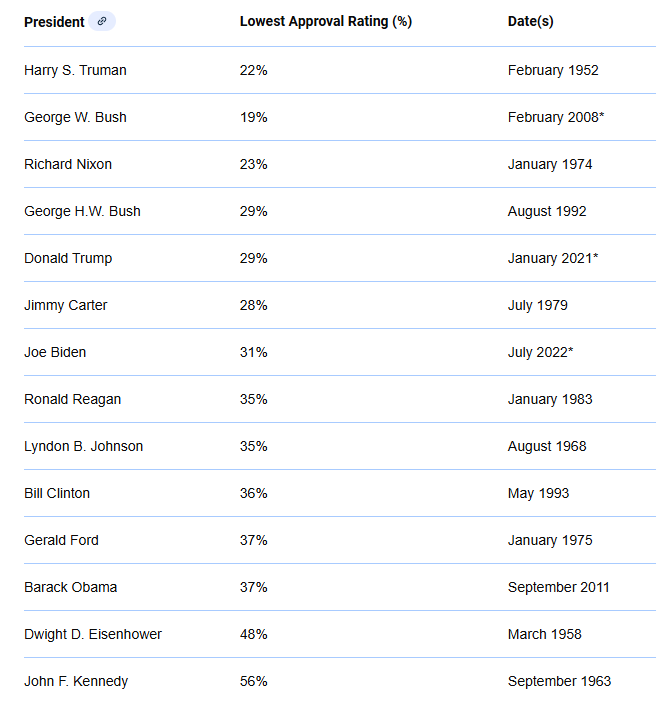
I'm going to throw in one more piece of "data" on historical views of presidential approval. We tend to focus on positive approval ratings, but how about comparing the low points of presidents since World War II? Keep in mind, in many cases these low levels of public approval were right before they left office, either voluntarily (at the end of 2 terms) or involuntarily (voted out by the electorate). Not too many, though, left as popular as they came in (which is also true historically):
What does it tell us that the only president never to drop below 50% approval was Kennedy (who was assassinated less than 3 years into his first term), and that only one other president in the past 80 years never dropped below 40%? If nothing else, there is an element of "What have you done for me lately?" reflected in the results of any poll (or election, for that matter). But is that unique to the U.S.? We'll look a bit at that in Part II of this post tomorrow . . .
Resources just for Part I:
"President Trump Job Approval Polling Averages", Real Clear Politics, Jan 2026, https://www.realclearpolling.com/polls/approval/donald-trump/approval-rating
"Presidential Approval Highs & Lows", Roper Center for Public Opinion Research, https://ropercenter.cornell.edu/presidential-approval/highslows
"Rising partisan antipathy; widening party gap in presidential job approval", Pew Research Center, Aug 2022, https://www.pewresearch.org/politics/2022/08/09/rising-partisan-antipathy-widening-party-gap-in-presidential-job-approval/
"Trump Ratings and U.S. Mood Stay Tepid in August", Gallup News, Aug 2025, https://news.gallup.com/poll/694370/trump-ratings-mood-stay-tepid-august.aspx
As I noted above, this is not going to be a post about politics - simply the importance of giving some perspective to data or facts rather than saying "We fact-checked it, so it must be true". Let me start with an example of what I mean . . .
THE LAW - All fireworks that explode or leave the ground are illegal under Colorado state law. Many local municipalities, including Denver and Colorado Springs, have even stricter rules that ban all personal fireworks, including sparklers, due to fire danger.
THE ONLINE STATEMENT - On the social media site Reddit, one thread posted by a user in Colorado Springs described last night (7/3) as sounding “like an active war zone outside.” The post generated hundreds of comments, with many lamenting the amount of launches and booms around the area.
THE FACT CHECK (from the Colorado Sun) - "Denver and the city of Colorado Springs ban the use and possession of all fireworks, even sparklers, joining several cities across the state . . . punishments for violating the local prohibitions vary. Colorado Springs can punish violators with a fine of up to $2,500 or 189 days in jail. Denver can levy fines up to $999 and up to a year in jail."
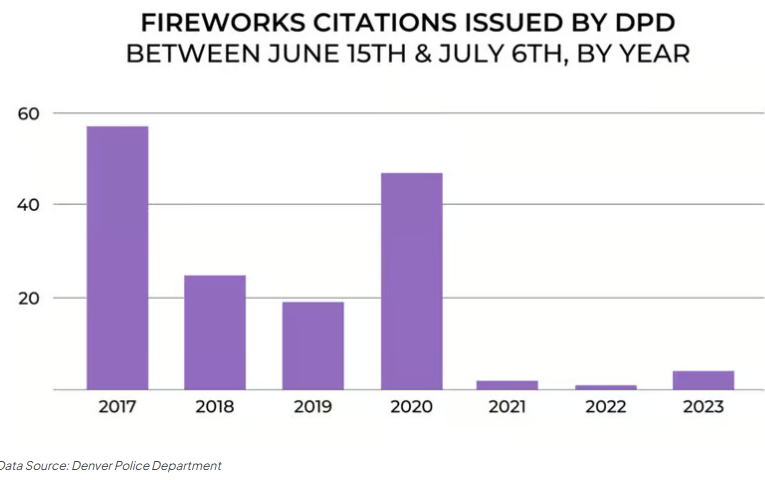
PERSPECTIVE (from 9 News and Westword) - Denver had 1500 reports to police about fireworks in late Jun/early Jul 2025 . . . and issued 6 citations. Here's a graph Denverite did based on released data over the past 9 years (including the 3 tickets in 2024 and this year's 6):
Now you can interpret this data in a variety of ways. I've seen plenty of back-and-forth arguments online (including my neighborhood's chat) about whether people should be breaking the law or not. And the facts are all accurate - what the law says is accurately quoted.
But just saying "it's illegal" or "they give out tickets" doesn't give anyone the full story without noting a) the number of complaints vs the number of tickets and b) the change in police procedure since the start of the pandemic. I want students to be informed consumers of the news, whether they are getting it from traditional media, Reddit chatrooms, or TikTok videos.
ECON and More
Curating articles for K-12 education.
CONTACT
© 2025. All rights reserved.